


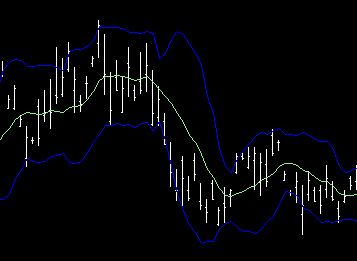
Bollinger Bands are a popular technical analysis tool that we often encounter in the world of trading and investing. Developed by John Bollinger in the early 1980s, these bands consist of a middle line, which is typically a simple moving average (SMA), flanked by two outer bands that are calculated based on the standard deviation of the price. This unique structure allows us to visualize price volatility and identify potential trading opportunities.
As we delve deeper into the mechanics of Bollinger Bands, we will discover how they can serve as a valuable asset in our trading toolkit. The primary purpose of Bollinger Bands is to provide insight into market conditions, particularly in terms of volatility and price levels. When the market experiences low volatility, the bands contract, indicating a period of consolidation.
Conversely, when volatility increases, the bands expand, suggesting that significant price movements may be on the horizon. By understanding these dynamics, we can better position ourselves to make informed trading decisions and capitalize on market fluctuations.
Key Takeaways
- Bollinger Bands are a technical analysis tool that helps traders identify overbought and oversold conditions in the market.
- Overbought and oversold conditions occur when the price of an asset has moved significantly in one direction and may be due for a reversal.
- Bollinger Bands can help identify overbought conditions when the price is at the upper band and oversold conditions when the price is at the lower band.
- Traders can use Bollinger Bands to time entry and exit points by looking for price reversals when the bands are stretched or contracted.
- Common mistakes to avoid when using Bollinger Bands include relying solely on them for trading decisions and not considering other technical indicators.
Understanding Overbought and Oversold Conditions
In our trading journey, we often hear the terms “overbought” and “oversold.” These concepts are crucial for identifying potential reversals in price trends. An overbought condition occurs when an asset’s price has risen significantly and is considered too high relative to its intrinsic value. This situation often leads to a price correction as traders begin to take profits or as new buyers become scarce.
On the other hand, an oversold condition arises when an asset’s price has fallen sharply, making it appear undervalued. In this scenario, we may see a rebound as buyers step in to take advantage of the perceived bargain. Recognizing these conditions is essential for successful trading.
Overbought and oversold signals can help us determine when to enter or exit trades, allowing us to maximize our profits while minimizing potential losses.
However, it is important to remember that these conditions do not guarantee immediate reversals; rather, they serve as indicators that we should consider when making our trading decisions.
How Bollinger Bands Can Identify Overbought and Oversold Conditions


Bollinger Bands provide us with a visual representation of overbought and oversold conditions through their interaction with price movements. When the price approaches the upper band, it suggests that the asset may be overbought, indicating a potential reversal or pullback. Conversely, when the price nears the lower band, it signals that the asset may be oversold, presenting an opportunity for a rebound.
This relationship between price and the bands allows us to gauge market sentiment and make more informed trading choices. Moreover, the width of the bands can also offer insights into market conditions. A narrow band indicates low volatility and can signal a potential breakout, while a wide band suggests high volatility and may indicate that a trend is in motion.
By combining these observations with our understanding of overbought and oversold conditions, we can enhance our ability to identify potential trading opportunities.
Using Bollinger Bands to Time Entry and Exit Points
Timing our entry and exit points is crucial for successful trading, and Bollinger Bands can assist us in this endeavor. When we observe that the price has reached the upper band, it may be an opportune moment to consider selling or taking profits on our long positions. Conversely, if the price approaches the lower band, it could signal a buying opportunity for those looking to enter a long position or add to an existing one.
In addition to these signals, we can also look for confirmation from other technical indicators or chart patterns to strengthen our decision-making process. For instance, if we see a bearish divergence between price and an oscillator like the Relative Strength Index (RSI) while the price is at the upper band, it may reinforce our decision to sell. Similarly, if we notice bullish divergence at the lower band, it could provide additional confidence in our decision to buy.
Common Mistakes to Avoid When Using Bollinger Bands for Overbought and Oversold Conditions
While Bollinger Bands can be powerful tools for identifying overbought and oversold conditions, there are common pitfalls that we should be wary of. One frequent mistake is relying solely on the bands without considering other factors such as market context or fundamental analysis. It is essential to remember that Bollinger Bands are just one piece of the puzzle; they should be used in conjunction with other indicators and analysis techniques to form a comprehensive trading strategy.
Another common error is misinterpreting the signals provided by Bollinger Bands. For instance, just because the price touches the upper band does not mean we should immediately sell; it is crucial to assess whether there are other confirming signals or if the trend remains strong. Similarly, an oversold condition does not guarantee an immediate reversal; we must remain vigilant and consider market sentiment before making any decisions.
Strategies for Trading Overbought and Oversold Conditions with Bollinger Bands

To effectively trade overbought and oversold conditions using Bollinger Bands, we can implement several strategies that align with our trading goals. One approach is to use a combination of Bollinger Bands with momentum indicators like the RSI or Stochastic Oscillator. By doing so, we can gain additional confirmation of overbought or oversold conditions before executing trades.
For example, if we see that the price has reached the upper Bollinger Band while the RSI indicates overbought conditions (above 70), this could strengthen our case for selling or taking profits. Conversely, if the price approaches the lower band while the RSI shows oversold conditions (below 30), it may signal a buying opportunity. This multi-faceted approach allows us to make more informed decisions based on a broader range of data.
Another effective strategy involves using Bollinger Band squeezes as a precursor to potential breakouts. When we notice that the bands have contracted significantly, it often indicates that a period of low volatility is coming to an end. We can prepare for potential breakouts by placing buy or sell orders just outside the bands once they begin to expand again.
This strategy allows us to capitalize on significant price movements as they occur.
Tips for Successful Trading Using Bollinger Bands

To enhance our success when using Bollinger Bands in our trading endeavors, there are several tips we can keep in mind. First and foremost, we should always consider the overall market trend before making any decisions based on Bollinger Band signals. If we are trading in a strong uptrend, it may be prudent to focus on buying opportunities even when prices reach the upper band.
Additionally, we should remain patient and avoid making impulsive decisions based solely on short-term fluctuations. It is essential to allow trades time to develop and not react hastily to every touch of the bands. By maintaining discipline and adhering to our trading plan, we can improve our chances of success.
Lastly, continuous education and practice are vital components of successful trading with Bollinger Bands. We should regularly review our trades and analyze what worked well and what didn’t. By learning from our experiences and staying informed about market developments, we can refine our strategies and become more adept at using Bollinger Bands effectively.
Conclusion and Key Takeaways for Using Bollinger Bands to Identify Overbought and Oversold Conditions
In conclusion, Bollinger Bands serve as a valuable tool for identifying overbought and oversold conditions in financial markets. By understanding how these bands function and their relationship with price movements, we can enhance our ability to make informed trading decisions. Recognizing overbought and oversold signals allows us to time our entries and exits more effectively while avoiding common pitfalls associated with their use.
As we continue our trading journey, it is essential to remember that Bollinger Bands should be used in conjunction with other indicators and analysis techniques for optimal results. By implementing sound strategies and maintaining discipline in our approach, we can harness the power of Bollinger Bands to navigate market fluctuations successfully. Ultimately, continuous learning and adaptation will be key as we strive for success in our trading endeavors using this versatile tool.
FAQs
What are Bollinger Bands?
Bollinger Bands are a technical analysis tool that consists of a moving average line and two standard deviation lines, which create a band around the price of a security. They are used to measure the volatility and identify overbought and oversold conditions in the market.
How do Bollinger Bands identify overbought and oversold conditions?
Bollinger Bands identify overbought conditions when the price of a security touches or exceeds the upper band, and oversold conditions when the price touches or falls below the lower band. These conditions suggest that the price may be due for a reversal.
How are Bollinger Bands used in trading?
Traders use Bollinger Bands to identify potential entry and exit points in the market. When the price touches the upper band, it may be a signal to sell, while touching the lower band may be a signal to buy. Traders also look for the bands to squeeze together, indicating a period of low volatility and potential breakout.
Are Bollinger Bands a guaranteed indicator of overbought and oversold conditions?
No, Bollinger Bands are not a guaranteed indicator of overbought and oversold conditions. They are just one tool among many used in technical analysis, and should be used in conjunction with other indicators and analysis methods for more accurate trading decisions.
Can Bollinger Bands be used for all types of securities?
Bollinger Bands can be used for a wide variety of securities, including stocks, commodities, forex, and cryptocurrencies. However, it’s important to adjust the parameters of the bands (such as the period and standard deviation) to suit the specific characteristics of the security being analyzed.


