


As we delve into the world of trading and market analysis, one term that frequently comes up is the Average True Range (ATR). This technical indicator, developed by J. Welles Wilder Jr. in the late 1970s, serves as a measure of market volatility. Unlike traditional measures of volatility that might focus solely on price changes, ATR takes into account the true range of price movements over a specified period. This includes not just the high and low prices of a given trading session but also any gaps that may occur between sessions. By doing so, ATR provides a more comprehensive view of how much an asset’s price can fluctuate, which is crucial for traders looking to manage risk effectively. Understanding ATR is essential for anyone involved in trading, whether we are seasoned professionals or newcomers to the field. The indicator is typically calculated over a set number of periods, such as 14 days, and it provides insights into how much an asset’s price has varied during that time. A higher ATR indicates greater volatility, suggesting that the asset’s price is experiencing larger swings, while a lower ATR signifies a more stable price environment. This understanding allows us to gauge not only the current market conditions but also to anticipate potential future movements based on historical volatility.
Key Takeaways
- ATR measures market volatility by calculating the average range between high and low prices over a specific period.
- To calculate ATR, take the true range for each period, typically 14 days, and then calculate the average of those true ranges.
- ATR can be used to gauge market volatility, with higher ATR values indicating higher volatility and lower values indicating lower volatility.
- Traders can use ATR to set stop-loss levels, determine position sizes, and identify potential trend reversals.
- ATR is just one of many volatility indicators, and traders should consider using other measures such as Bollinger Bands and the VIX to gain a comprehensive understanding of market volatility.
Calculating ATR: A Step-by-Step Guide to Measuring Market Volatility
Calculating the Average True Range involves a few straightforward steps that we can easily follow. First, we need to determine the True Range (TR) for each period we are analyzing. The True Range is defined as the greatest of the following three values: the current high minus the current low, the absolute value of the current high minus the previous close, and the absolute value of the current low minus the previous close.
By identifying these values, we can capture all potential price movements, including gaps that may occur between trading sessions.
Once we have calculated the True Range for each period, we can then compute the Average True Range. This is typically done by taking the average of the True Range values over a specified number of periods, such as 14 days.
For example, if we are analyzing a stock’s ATR over 14 days, we would sum up the True Range values for those 14 days and then divide by 14. This gives us a smoothed measure of volatility that can be used to inform our trading decisions. By following this methodical approach, we can gain valuable insights into market behavior and make more informed choices.
Interpreting ATR: How to Use Average True Range to Gauge Market Volatility

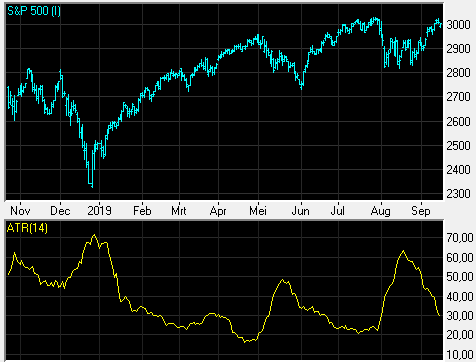
Interpreting the Average True Range is crucial for understanding market dynamics and making informed trading decisions. A rising ATR indicates increasing volatility, which may suggest that significant price movements are on the horizon. For traders, this can signal an opportunity to enter or exit positions based on their risk tolerance and market strategy.
Conversely, a declining ATR suggests that volatility is decreasing, which may indicate a more stable market environment where price movements are less pronounced. Moreover, we can use ATR in conjunction with other technical indicators to enhance our trading strategies. For instance, when combined with trend indicators like moving averages, ATR can help us identify whether a trend is gaining momentum or losing strength.
If we observe a rising ATR alongside an upward trend, it may reinforce our confidence in continuing to hold long positions. On the other hand, if we see a declining ATR during an upward trend, it could signal that the trend is losing steam and may be due for a reversal.
ATR in Practice: Real-Life Examples of Using Average True Range in Trading
To illustrate how we can apply Average True Range in real-life trading scenarios, let’s consider a couple of examples. Imagine we are trading a volatile stock that has recently experienced significant price swings. By monitoring its ATR, we notice that it has been steadily increasing over several weeks.
This information could prompt us to adjust our stop-loss orders further away from our entry point to accommodate for potential price fluctuations. By doing so, we can avoid being prematurely stopped out of our positions during normal market volatility. In another scenario, suppose we are day trading a currency pair that typically exhibits low volatility.
If we observe that its ATR has suddenly spiked, it may indicate an upcoming news event or market catalyst that could lead to increased price movement. In this case, we might decide to capitalize on this heightened volatility by increasing our position size or employing different trading strategies that take advantage of rapid price changes. These examples highlight how ATR can serve as a valuable tool in our trading arsenal, helping us make timely and informed decisions based on market conditions.
ATR vs Other Volatility Indicators: A Comparison of Different Market Volatility Measures
When it comes to measuring market volatility, there are several indicators available to us beyond Average True Range. One common alternative is Bollinger Bands, which utilize standard deviations from a moving average to gauge volatility. While Bollinger Bands provide visual cues about price levels relative to historical volatility, they do not account for gaps or overnight price changes like ATR does.
This distinction makes ATR particularly useful for traders who want a more comprehensive view of market fluctuations. Another popular volatility measure is the VIX index, often referred to as the “fear index.” The VIX reflects market expectations of future volatility based on options pricing and is widely used by investors to gauge overall market sentiment. However, unlike ATR, which focuses on individual asset price movements, the VIX provides a broader perspective on market volatility across various assets.
Each of these indicators has its strengths and weaknesses; thus, understanding their differences allows us to choose the most appropriate tool for our specific trading strategies.
ATR Strategies: How Traders Can Utilize Average True Range to Make Informed Decisions


Incorporating Average True Range into our trading strategies can significantly enhance our decision-making process. One common approach is using ATR to set stop-loss orders effectively. By placing stop-loss orders at a multiple of the ATR away from our entry point—such as 1.5 or 2 times the ATR—we can account for normal price fluctuations while still protecting ourselves from larger adverse moves.
This method allows us to maintain our positions during typical volatility without exposing ourselves to unnecessary risk. Additionally, we can use ATR to determine position sizing based on market conditions. For instance, when ATR is high and indicates increased volatility, we might choose to reduce our position size to mitigate risk.
Conversely, when ATR is low and suggests a more stable environment, we could increase our position size to capitalize on potential opportunities. By adapting our strategies based on ATR readings, we can align our risk management practices with prevailing market conditions.
ATR Limitations: Factors to Consider When Using Average True Range for Market Volatility

While Average True Range is a valuable tool for assessing market volatility, it is essential for us to recognize its limitations as well. One significant drawback is that ATR is a lagging indicator; it relies on historical price data and may not accurately predict future volatility or sudden market shifts. As traders, we must remain vigilant and consider other factors—such as economic news releases or geopolitical events—that could impact market conditions beyond what ATR indicates.
Moreover, ATR does not provide directional information; it merely measures how much an asset’s price fluctuates without indicating whether those fluctuations are upward or downward. Therefore, while it can inform us about potential volatility levels, it should be used in conjunction with other indicators that provide insights into market trends and directionality. By acknowledging these limitations and integrating ATR with other analytical tools, we can develop a more comprehensive understanding of market dynamics.
The Importance of ATR in Understanding and Navigating Market Volatility
In conclusion, Average True Range serves as an essential tool for traders seeking to understand and navigate market volatility effectively. By providing insights into price fluctuations and helping us gauge potential risk levels, ATR empowers us to make informed decisions in our trading endeavors. Whether we are setting stop-loss orders or adjusting position sizes based on prevailing market conditions, incorporating ATR into our strategies can enhance our overall trading performance.
As we continue to explore various aspects of trading and market analysis, it becomes clear that understanding indicators like Average True Range is crucial for success in this dynamic environment. By leveraging its insights alongside other analytical tools and remaining aware of its limitations, we can better position ourselves to capitalize on opportunities while managing risk effectively in an ever-changing marketplace.
FAQs
What is Average True Range (ATR)?
Average True Range (ATR) is a technical analysis indicator that measures market volatility by analyzing the range of price movements for a financial instrument over a specified period of time.
How is ATR calculated?
ATR is calculated by taking the average of the true range values over a specified period. The true range is the greatest of the following: current high minus the current low, the absolute value of the current high minus the previous close, and the absolute value of the current low minus the previous close.
What does ATR indicate about market volatility?
ATR provides a measure of the average price range or volatility of a financial instrument over a specific period of time. Higher ATR values indicate higher volatility, while lower ATR values indicate lower volatility.
How can ATR be used in trading?
Traders and investors use ATR to assess the volatility of a financial instrument and to set stop-loss and take-profit levels. A higher ATR value may lead to wider stop-loss and take-profit levels, while a lower ATR value may lead to tighter levels.
What are the limitations of ATR?
ATR is a historical volatility indicator and may not always accurately predict future price movements. Additionally, ATR does not provide information about the direction of price movements, only the magnitude of volatility.


